
Reportable crashes, injuries, crash rates and crash costs for all 100 North Carolina counties, compiled from NCDOT’s 2024 Traffic Crash Facts into one sortable table, five charts, a free CSV and a PDF.
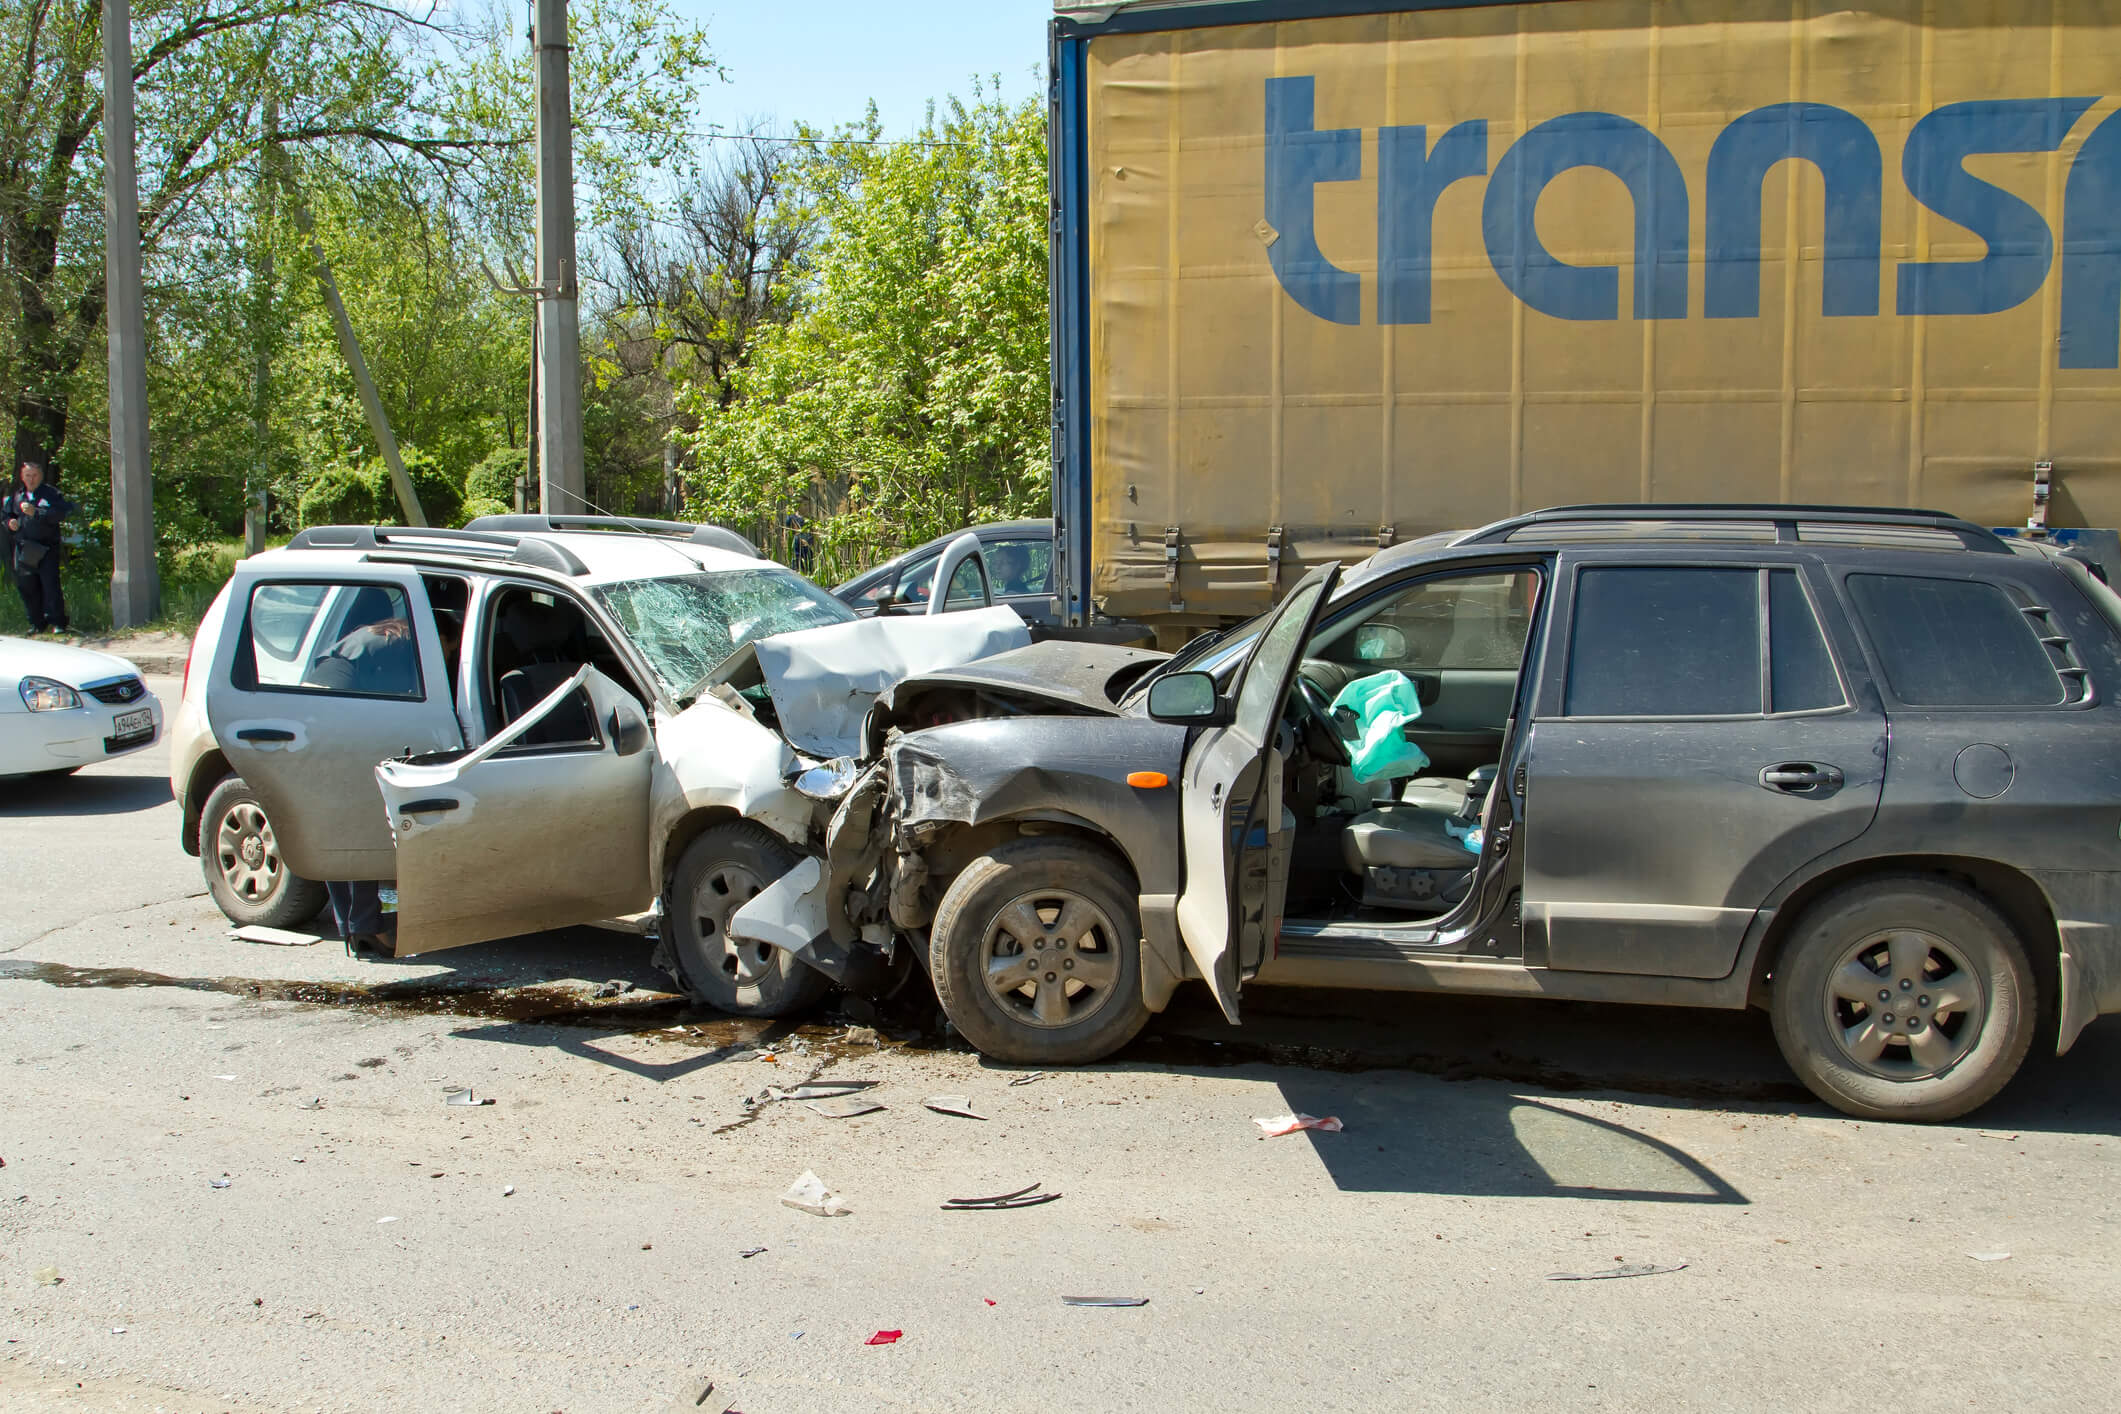
Click any column heading to sort. Rates are NCDOT three-year averages; change and share are computed from the 2023 and 2024 counts. Source: NCDOT/NCDMV 2024 Traffic Crash Facts county profiles.
| # | County | Crashes 2024 | Injury crashes | People injured | Crashes 2023 | Change | 5-yr avg | Share of NC | Per 100M VMT | Per 1,000 vehicles | Injuries per 1,000 people | Alcohol-related | Pedestrian | Bicycle | Motorcycle | Population | Annual crash cost |
|---|---|---|---|---|---|---|---|---|---|---|---|---|---|---|---|---|---|
| 1 | Mecklenburg | 37,228 | 10,189 | 16,831 | 37,900 | -1.8% | 35,905 | 13.1% | 330.7 | 57.8 | 15.5 | 922 | 454 | 124 | 316 | 1,162,168 | $4,143M |
| 2 | Wake | 33,284 | 7,818 | 12,050 | 32,874 | +1.2% | 30,465 | 11.7% | 349.3 | 46.7 | 10.3 | 965 | 276 | 77 | 303 | 1,194,900 | $3,494M |
| 3 | Guilford | 14,948 | 5,097 | 7,950 | 14,576 | +2.6% | 14,011 | 5.3% | 267.6 | 40.7 | 15.1 | 578 | 199 | 44 | 162 | 550,202 | $1,960M |
| 4 | Forsyth | 12,166 | 3,131 | 4,682 | 12,011 | +1.3% | 11,475 | 4.3% | 363.4 | 52.3 | 12.2 | 467 | 102 | 28 | 140 | 393,062 | $1,489M |
| 5 | Durham | 10,004 | 2,413 | 3,512 | 10,015 | -0.1% | 9,578 | 3.5% | 355.9 | 61.9 | 11.5 | 312 | 136 | 28 | 85 | 337,263 | $1,132M |
| 6 | Cumberland | 7,439 | 1,984 | 3,147 | 7,729 | -3.8% | 7,500 | 2.6% | 323.3 | 45.1 | 11.2 | 236 | 107 | 20 | 157 | 337,970 | $1,431M |
| 7 | Buncombe | 7,379 | 1,663 | 2,292 | 7,902 | -6.6% | 7,434 | 2.6% | 322.7 | 41.2 | 9.3 | 322 | 70 | 20 | 119 | 277,047 | $1,008M |
| 8 | Gaston | 7,311 | 1,709 | 2,843 | 6,779 | +7.8% | 6,764 | 2.6% | 391.0 | 48.7 | 11.8 | 261 | 49 | 25 | 111 | 240,820 | $878M |
| 9 | Union | 5,954 | 1,299 | 1,982 | 5,904 | +0.8% | 5,528 | 2.1% | 412.0 | 31.4 | 8.2 | 245 | 24 | 8 | 61 | 257,682 | $721M |
| 10 | Cabarrus | 5,892 | 1,417 | 2,240 | 5,959 | -1.1% | 5,730 | 2.1% | 309.1 | 35.6 | 9.5 | 223 | 32 | 15 | 71 | 242,880 | $698M |
| 11 | New Hanover | 5,835 | 1,504 | 2,170 | 5,807 | +0.5% | 5,581 | 2.1% | 414.5 | 39.6 | 9.2 | 329 | 70 | 73 | 104 | 239,514 | $662M |
| 12 | Johnston | 5,755 | 1,465 | 2,295 | 5,755 | +0.0% | 5,507 | 2.0% | 271.2 | 33.5 | 9.7 | 312 | 30 | 11 | 64 | 241,049 | $892M |
| 13 | Pitt | 5,611 | 1,452 | 2,468 | 5,600 | +0.2% | 5,470 | 2.0% | 461.5 | 48.8 | 15.2 | 170 | 48 | 21 | 48 | 174,842 | $777M |
| 14 | Iredell | 5,081 | 1,459 | 2,300 | 4,961 | +2.4% | 4,755 | 1.8% | 283.2 | 32.7 | 11.4 | 234 | 29 | 16 | 73 | 202,038 | $724M |
| 15 | Catawba | 4,843 | 1,241 | 1,899 | 4,801 | +0.9% | 4,692 | 1.7% | 340.9 | 37.9 | 11.6 | 181 | 28 | 20 | 82 | 166,196 | $694M |
| 16 | Alamance | 4,654 | 1,183 | 1,805 | 4,605 | +1.1% | 4,405 | 1.6% | 345.7 | 36.0 | 10.0 | 171 | 24 | 7 | 64 | 181,097 | $673M |
| 17 | Robeson | 4,518 | 1,219 | 1,980 | 4,577 | -1.3% | 4,295 | 1.6% | 310.5 | 53.9 | 17.3 | 269 | 35 | 16 | 61 | 116,438 | $1,078M |
| 18 | Orange | 4,139 | 932 | 1,339 | 4,240 | -2.4% | 3,468 | 1.5% | 263.2 | 40.4 | 10.1 | 144 | 36 | 27 | 34 | 150,913 | $493M |
| 19 | Onslow | 3,927 | 1,054 | 1,714 | 3,946 | -0.5% | 4,054 | 1.4% | 312.6 | 31.6 | 8.1 | 189 | 39 | 16 | 123 | 213,447 | $670M |
| 20 | Davidson | 3,916 | 1,016 | 1,539 | 3,957 | -1.0% | 3,821 | 1.4% | 256.1 | 24.8 | 8.9 | 169 | 19 | 9 | 84 | 176,388 | $704M |
| 21 | Randolph | 3,705 | 1,008 | 1,600 | 3,634 | +2.0% | 3,570 | 1.3% | 295.7 | 28.8 | 10.9 | 191 | 23 | 9 | 57 | 146,496 | $662M |
| 22 | Rowan | 3,675 | 1,040 | 1,629 | 3,606 | +1.9% | 3,521 | 1.3% | 281.3 | 29.1 | 10.7 | 176 | 42 | 15 | 71 | 152,450 | $628M |
| 23 | Brunswick | 3,380 | 681 | 1,037 | 3,281 | +3.0% | 3,133 | 1.2% | 235.2 | 26.8 | 7.3 | 133 | 19 | 13 | 34 | 160,440 | $523M |
| 24 | Wayne | 3,298 | 1,008 | 1,663 | 3,311 | -0.4% | 3,249 | 1.2% | 377.9 | 37.9 | 14.8 | 163 | 22 | 9 | 31 | 117,748 | $580M |
| 25 | Harnett | 3,101 | 752 | 1,170 | 3,091 | +0.3% | 2,976 | 1.1% | 292.7 | 31.1 | 9.0 | 182 | 25 | 10 | 44 | 140,984 | $559M |
| 26 | Henderson | 3,004 | 664 | 962 | 3,113 | -3.5% | 2,933 | 1.1% | 317.2 | 32.4 | 8.5 | 169 | 15 | 7 | 50 | 120,597 | $368M |
| 27 | Cleveland | 2,674 | 655 | 1,018 | 2,500 | +7.0% | 2,741 | 0.9% | 323.1 | 34.4 | 11.2 | 101 | 15 | 3 | 43 | 100,498 | $442M |
| 28 | Moore | 2,535 | 625 | 906 | 2,613 | -3.0% | 2,454 | 0.9% | 346.8 | 29.3 | 9.1 | 113 | 12 | 6 | 35 | 107,861 | $430M |
| 29 | Nash | 2,502 | 721 | 1,138 | 2,650 | -5.6% | 2,588 | 0.9% | 217.1 | 35.4 | 12.9 | 153 | 21 | 11 | 17 | 97,802 | $464M |
| 30 | Craven | 2,463 | 574 | 885 | 2,397 | +2.8% | 2,336 | 0.9% | 334.9 | 30.8 | 9.0 | 106 | 20 | 14 | 44 | 103,605 | $366M |
| 31 | Burke | 2,256 | 568 | 820 | 2,078 | +8.6% | 2,102 | 0.8% | 265.6 | 29.2 | 9.5 | 99 | 17 | 4 | 64 | 89,974 | $331M |
| 32 | Wilson | 2,254 | 617 | 1,011 | 2,419 | -6.8% | 2,491 | 0.8% | 288.2 | 40.5 | 13.6 | 89 | 15 | 4 | 13 | 78,792 | $378M |
| 33 | Rockingham | 1,928 | 475 | 701 | 2,077 | -7.2% | 2,002 | 0.7% | 250.4 | 24.2 | 8.2 | 101 | 14 | 2 | 27 | 92,416 | $309M |
| 34 | Lincoln | 1,926 | 409 | 593 | 2,011 | -4.2% | 1,908 | 0.7% | 292.6 | 25.2 | 7.0 | 75 | 3 | 6 | 30 | 94,819 | $291M |
| 35 | Pender | 1,846 | 392 | 629 | 1,770 | +4.3% | 1,661 | 0.6% | 228.7 | 29.5 | 9.7 | 97 | 5 | 7 | 25 | 67,464 | $275M |
| 36 | Sampson | 1,833 | 393 | 561 | 1,839 | -0.3% | 1,781 | 0.6% | 273.6 | 32.0 | 11.3 | 107 | 6 | 2 | 15 | 59,514 | $416M |
| 37 | Duplin | 1,775 | 408 | 658 | 1,746 | +1.7% | 1,705 | 0.6% | 257.0 | 34.9 | 13.6 | 91 | 7 | 5 | 12 | 49,178 | $379M |
| 38 | Caldwell | 1,770 | 471 | 698 | 1,887 | -6.2% | 1,823 | 0.6% | 352.8 | 27.0 | 8.5 | 80 | 16 | 11 | 43 | 81,960 | $341M |
| 39 | Columbus | 1,769 | 424 | 702 | 1,833 | -3.5% | 1,759 | 0.6% | 261.8 | 40.1 | 14.4 | 50 | 13 | 3 | 19 | 50,389 | $375M |
| 40 | Chatham | 1,724 | 400 | 552 | 1,760 | -2.0% | 1,658 | 0.6% | 203.0 | 22.8 | 7.0 | 77 | 12 | 1 | 26 | 81,248 | $318M |
| 41 | Surry | 1,639 | 473 | 695 | 1,599 | +2.5% | 1,543 | 0.6% | 178.3 | 19.2 | 10.3 | 70 | 9 | 5 | 43 | 71,774 | $289M |
| 42 | Lee | 1,628 | 393 | 581 | 1,624 | +0.2% | 1,639 | 0.6% | 259.9 | 31.9 | 9.0 | 58 | 15 | 4 | 25 | 67,308 | $308M |
| 43 | Wilkes | 1,522 | 430 | 628 | 1,413 | +7.7% | 1,426 | 0.5% | 250.1 | 21.3 | 9.4 | 74 | 7 | 2 | 41 | 65,987 | $314M |
| 44 | Lenoir | 1,520 | 441 | 757 | 1,567 | -3.0% | 1,481 | 0.5% | 275.0 | 31.7 | 14.1 | 87 | 7 | 5 | 11 | 53,966 | $266M |
| 45 | Franklin | 1,486 | 424 | 687 | 1,567 | -5.2% | 1,417 | 0.5% | 282.0 | 23.9 | 9.1 | 94 | 5 | 1 | 19 | 77,561 | $356M |
| 46 | Haywood | 1,474 | 352 | 508 | 1,638 | -10.0% | 1,378 | 0.5% | 192.1 | 29.7 | 9.5 | 51 | 10 | 5 | 41 | 63,949 | $256M |
| 47 | Carteret | 1,471 | 358 | 548 | 1,410 | +4.3% | 1,379 | 0.5% | 282.8 | 23.2 | 7.8 | 82 | 13 | 10 | 29 | 70,268 | $263M |
| 48 | Watauga | 1,423 | 257 | 368 | 1,431 | -0.6% | 1,377 | 0.5% | 379.3 | 44.1 | 7.2 | 66 | 15 | 3 | 17 | 54,972 | $148M |
| 49 | Halifax | 1,377 | 311 | 456 | 1,526 | -9.8% | 1,462 | 0.5% | 273.0 | 36.9 | 13.0 | 67 | 14 | 3 | 9 | 46,616 | $315M |
| 50 | Stanly | 1,361 | 343 | 492 | 1,131 | +20.3% | 1,322 | 0.5% | 314.6 | 23.6 | 7.7 | 54 | 8 | 3 | 29 | 64,999 | $220M |
| 51 | Rutherford | 1,303 | 373 | 540 | 1,224 | +6.5% | 1,340 | 0.5% | 254.5 | 22.7 | 8.6 | 71 | 17 | 8 | 18 | 64,692 | $246M |
| 52 | Vance | 1,293 | 301 | 457 | 1,404 | -7.9% | 1,338 | 0.5% | 371.9 | 43.2 | 13.4 | 73 | 14 | 3 | 7 | 41,263 | $238M |
| 53 | Granville | 1,289 | 367 | 581 | 1,226 | +5.1% | 1,271 | 0.5% | 211.4 | 25.0 | 9.6 | 75 | 8 | 1 | 10 | 62,174 | $247M |
| 54 | Richmond | 1,274 | 334 | 538 | 1,154 | +10.4% | 1,189 | 0.4% | 289.4 | 38.5 | 12.8 | 59 | 14 | 3 | 14 | 42,068 | $246M |
| 55 | Edgecombe | 1,211 | 377 | 567 | 1,181 | +2.5% | 1,252 | 0.4% | 285.2 | 34.0 | 12.0 | 89 | 13 | 4 | 10 | 48,491 | $240M |
| 56 | Beaufort | 1,080 | 267 | 402 | 1,100 | -1.8% | 1,085 | 0.4% | 331.2 | 26.1 | 9.7 | 53 | 10 | 4 | 10 | 44,003 | $205M |
| 57 | Mcdowell | 1,042 | 234 | 360 | 1,054 | -1.1% | 1,055 | 0.4% | 199.3 | 26.7 | 8.5 | 42 | 7 | 3 | 27 | 44,521 | $167M |
| 58 | Hoke | 1,024 | 360 | 633 | 1,020 | +0.4% | 1,060 | 0.4% | 325.8 | 25.3 | 11.3 | 68 | 10 | 0 | 20 | 55,054 | $248M |
| 59 | Person | 1,009 | 251 | 373 | 989 | +2.0% | 1,016 | 0.4% | 346.6 | 25.4 | 8.8 | 45 | 8 | 3 | 12 | 39,461 | $151M |
| 60 | Jackson | 1,006 | 250 | 355 | 1,006 | +0.0% | 964 | 0.4% | 215.1 | 33.4 | 8.2 | 61 | 2 | 3 | 27 | 44,274 | $175M |
| 61 | Pasquotank | 1,001 | 260 | 399 | 952 | +5.1% | 951 | 0.4% | 418.6 | 34.7 | 10.8 | 38 | 6 | 4 | 15 | 41,417 | $168M |
| 62 | Bladen | 977 | 192 | 318 | 935 | +4.5% | 912 | 0.3% | 258.5 | 33.9 | 11.2 | 31 | 3 | 0 | 8 | 29,153 | $189M |
| 63 | Davie | 956 | 274 | 391 | 891 | +7.3% | 902 | 0.3% | 223.0 | 22.2 | 8.5 | 44 | 4 | 2 | 19 | 44,249 | $177M |
| 64 | Macon | 937 | 198 | 283 | 791 | +18.5% | 830 | 0.3% | 284.7 | 26.9 | 8.4 | 67 | 3 | 2 | 20 | 38,152 | $129M |
| 65 | Dare | 856 | 249 | 405 | 884 | -3.2% | 871 | 0.3% | 197.6 | 23.9 | 11.4 | 51 | 14 | 18 | 10 | 38,019 | $147M |
| 66 | Stokes | 836 | 238 | 336 | 816 | +2.5% | 787 | 0.3% | 256.7 | 16.6 | 7.4 | 38 | 3 | 1 | 31 | 45,493 | $169M |
| 67 | Anson | 800 | 187 | 290 | 792 | +1.0% | 797 | 0.3% | 252.0 | 38.1 | 13.9 | 38 | 8 | 2 | 9 | 21,619 | $178M |
| 68 | Scotland | 767 | 229 | 384 | 842 | -8.9% | 835 | 0.3% | 202.6 | 31.8 | 12.9 | 34 | 8 | 3 | 7 | 33,567 | $240M |
| 69 | Yadkin | 745 | 173 | 252 | 734 | +1.5% | 746 | 0.3% | 163.7 | 19.4 | 7.0 | 32 | 4 | 0 | 14 | 37,722 | $194M |
| 70 | Transylvania | 670 | 165 | 221 | 639 | +4.9% | 610 | 0.2% | 267.4 | 23.5 | 7.3 | 41 | 3 | 2 | 26 | 33,193 | $90M |
| 71 | Martin | 625 | 157 | 245 | 614 | +1.8% | 612 | 0.2% | 206.5 | 25.0 | 11.6 | 36 | 2 | 0 | 4 | 21,183 | $109M |
| 72 | Greene | 565 | 138 | 213 | 548 | +3.1% | 539 | 0.2% | 255.1 | 29.8 | 10.3 | 36 | 1 | 0 | 3 | 20,153 | $80M |
| 73 | Ashe | 555 | 122 | 156 | 532 | +4.3% | 495 | 0.2% | 242.7 | 18.3 | 6.2 | 23 | 1 | 1 | 14 | 26,694 | $81M |
| 74 | Cherokee | 554 | 132 | 182 | 537 | +3.2% | 537 | 0.2% | 221.0 | 22.4 | 7.1 | 36 | 3 | 0 | 14 | 29,691 | $110M |
| 75 | Polk | 546 | 146 | 202 | 542 | +0.7% | 499 | 0.2% | 147.0 | 24.4 | 9.1 | 23 | 2 | 0 | 18 | 19,742 | $90M |
| 76 | Montgomery | 535 | 125 | 178 | 552 | -3.1% | 584 | 0.2% | 182.7 | 19.0 | 8.3 | 14 | 5 | 2 | 11 | 25,833 | $180M |
| 77 | Alexander | 503 | 125 | 179 | 534 | -5.8% | 568 | 0.2% | 251.1 | 13.7 | 5.8 | 26 | 4 | 1 | 16 | 36,231 | $132M |
| 78 | Bertie | 483 | 123 | 178 | 459 | +5.2% | 463 | 0.2% | 185.6 | 25.6 | 11.0 | 13 | 1 | 0 | 5 | 16,856 | $90M |
| 79 | Northampton | 461 | 114 | 148 | 437 | +5.5% | 459 | 0.2% | 174.6 | 22.8 | 9.3 | 37 | 7 | 0 | 3 | 16,503 | $121M |
| 80 | Avery | 426 | 86 | 116 | 393 | +8.4% | 357 | 0.1% | 211.4 | 22.2 | 8.0 | 25 | 5 | 0 | 7 | 17,510 | $65M |
| 81 | Madison | 412 | 86 | 126 | 342 | +20.5% | 346 | 0.1% | 157.8 | 15.4 | 5.3 | 27 | 1 | 0 | 13 | 21,753 | $88M |
| 82 | Caswell | 401 | 102 | 153 | 415 | -3.4% | 409 | 0.1% | 192.3 | 17.3 | 7.0 | 24 | 2 | 0 | 8 | 22,461 | $92M |
| 83 | Hertford | 401 | 118 | 177 | 408 | -1.7% | 409 | 0.1% | 219.7 | 21.6 | 9.8 | 25 | 3 | 0 | 7 | 18,772 | $95M |
| 84 | Warren | 389 | 120 | 176 | 392 | -0.8% | 392 | 0.1% | 168.7 | 19.9 | 10.2 | 32 | 2 | 0 | 2 | 18,615 | $120M |
| 85 | Currituck | 362 | 140 | 225 | 438 | -17.4% | 407 | 0.1% | 109.8 | 12.8 | 7.1 | 21 | 2 | 3 | 5 | 31,396 | $84M |
| 86 | Jones | 344 | 96 | 127 | 380 | -9.5% | 363 | 0.1% | 175.8 | 33.4 | 12.8 | 13 | 2 | 0 | 6 | 9,208 | $57M |
| 87 | Yancey | 262 | 83 | 115 | 219 | +19.6% | 230 | 0.1% | 173.7 | 12.1 | 6.0 | 10 | 2 | 0 | 7 | 18,524 | $64M |
| 88 | Washington | 253 | 63 | 87 | 247 | +2.4% | 246 | 0.1% | 222.7 | 24.5 | 9.0 | 14 | 2 | 0 | 5 | 10,548 | $38M |
| 89 | Mitchell | 242 | 64 | 82 | 229 | +5.7% | 225 | 0.1% | 226.5 | 16.9 | 6.8 | 10 | 0 | 1 | 4 | 14,721 | $53M |
| 90 | Perquimans | 232 | 65 | 99 | 225 | +3.1% | 238 | 0.1% | 156.6 | 15.6 | 7.1 | 15 | 1 | 0 | 2 | 13,278 | $48M |
| 91 | Clay | 218 | 49 | 82 | 249 | -12.4% | 233 | 0.1% | 272.5 | 21.0 | 8.1 | 9 | 0 | 0 | 6 | 11,725 | $44M |
| 92 | Pamlico | 215 | 49 | 64 | 247 | -13.0% | 219 | 0.1% | 197.9 | 15.6 | 6.2 | 19 | 2 | 1 | 7 | 12,521 | $49M |
| 93 | Alleghany | 211 | 62 | 81 | 181 | +16.6% | 184 | 0.1% | 234.4 | 15.1 | 5.8 | 11 | 0 | 0 | 7 | 11,513 | $28M |
| 94 | Swain | 206 | 70 | 89 | 173 | +19.1% | 193 | 0.1% | 93.4 | 13.3 | 6.0 | 22 | 1 | 0 | 19 | 13,827 | $70M |
| 95 | Chowan | 200 | 54 | 75 | 217 | -7.8% | 219 | 0.1% | 188.1 | 14.0 | 7.0 | 17 | 1 | 0 | 1 | 13,710 | $38M |
| 96 | Graham | 181 | 76 | 92 | 142 | +27.5% | 156 | 0.1% | 234.6 | 21.5 | 11.4 | 4 | 0 | 0 | 48 | 7,985 | $64M |
| 97 | Camden | 175 | 56 | 74 | 172 | +1.7% | 167 | 0.1% | 122.5 | 14.0 | 6.9 | 8 | 0 | 1 | 2 | 10,737 | $23M |
| 98 | Gates | 174 | 50 | 71 | 147 | +18.4% | 159 | 0.1% | 141.0 | 13.1 | 7.7 | 12 | 2 | 0 | 4 | 10,297 | $69M |
| 99 | Tyrrell | 76 | 14 | 16 | 94 | -19.1% | 98 | 0.0% | 137.1 | 23.4 | 6.4 | 5 | 0 | 0 | 0 | 3,480 | $25M |
| 100 | Hyde | 60 | 17 | 18 | 38 | +57.9% | 66 | 0.0% | 101.8 | 8.6 | 2.9 | 4 | 0 | 0 | 1 | 4,671 | $7M |
Sorted by crashes in 2024, highest first.
North Carolina’s Division of Motor Vehicles publishes a crash profile for every county each year, but the profiles sit on a hundred separate pages of a PDF and cannot be compared side by side. This report puts them in one table. For each of the state’s 100 counties it shows the 2024 reportable crash count, injury crashes and people injured, the change from 2023, the five-year average, the county’s share of statewide crashes, NCDOT’s three-year crash rates per 100 million vehicle miles and per 1,000 registered vehicles, injuries per 1,000 residents, alcohol-related, pedestrian, bicycle and motorcycle crashes, population, and NCDOT’s comprehensive annual crash cost.
Every figure comes from the 2024 North Carolina Traffic Crash Facts published by NCDOT and NCDMV in September 2025, and the county figures reconcile exactly to the statewide totals in that report. The methodology page explains what a reportable crash is, how the rates are calculated, and how the table was built. The data is free to reuse with attribution; download the CSV or the PDF above. Joshua E. Palmer, Attorney at Law represents people injured in crashes across North Carolina and compiled this report as a public resource.
The crash count follows the population and the traffic. Mecklenburg County (Charlotte) recorded 37,228 reportable crashes in 2024, 13.1% of the state’s total, and Wake County (Raleigh) recorded 33,284. Guilford, Forsyth, Durham and Cumberland round out the six counties above 7,000 crashes. Together the ten counties with the most crashes account for 50% of everything reported statewide, while the fifty smallest counties combined account for a small fraction of that.
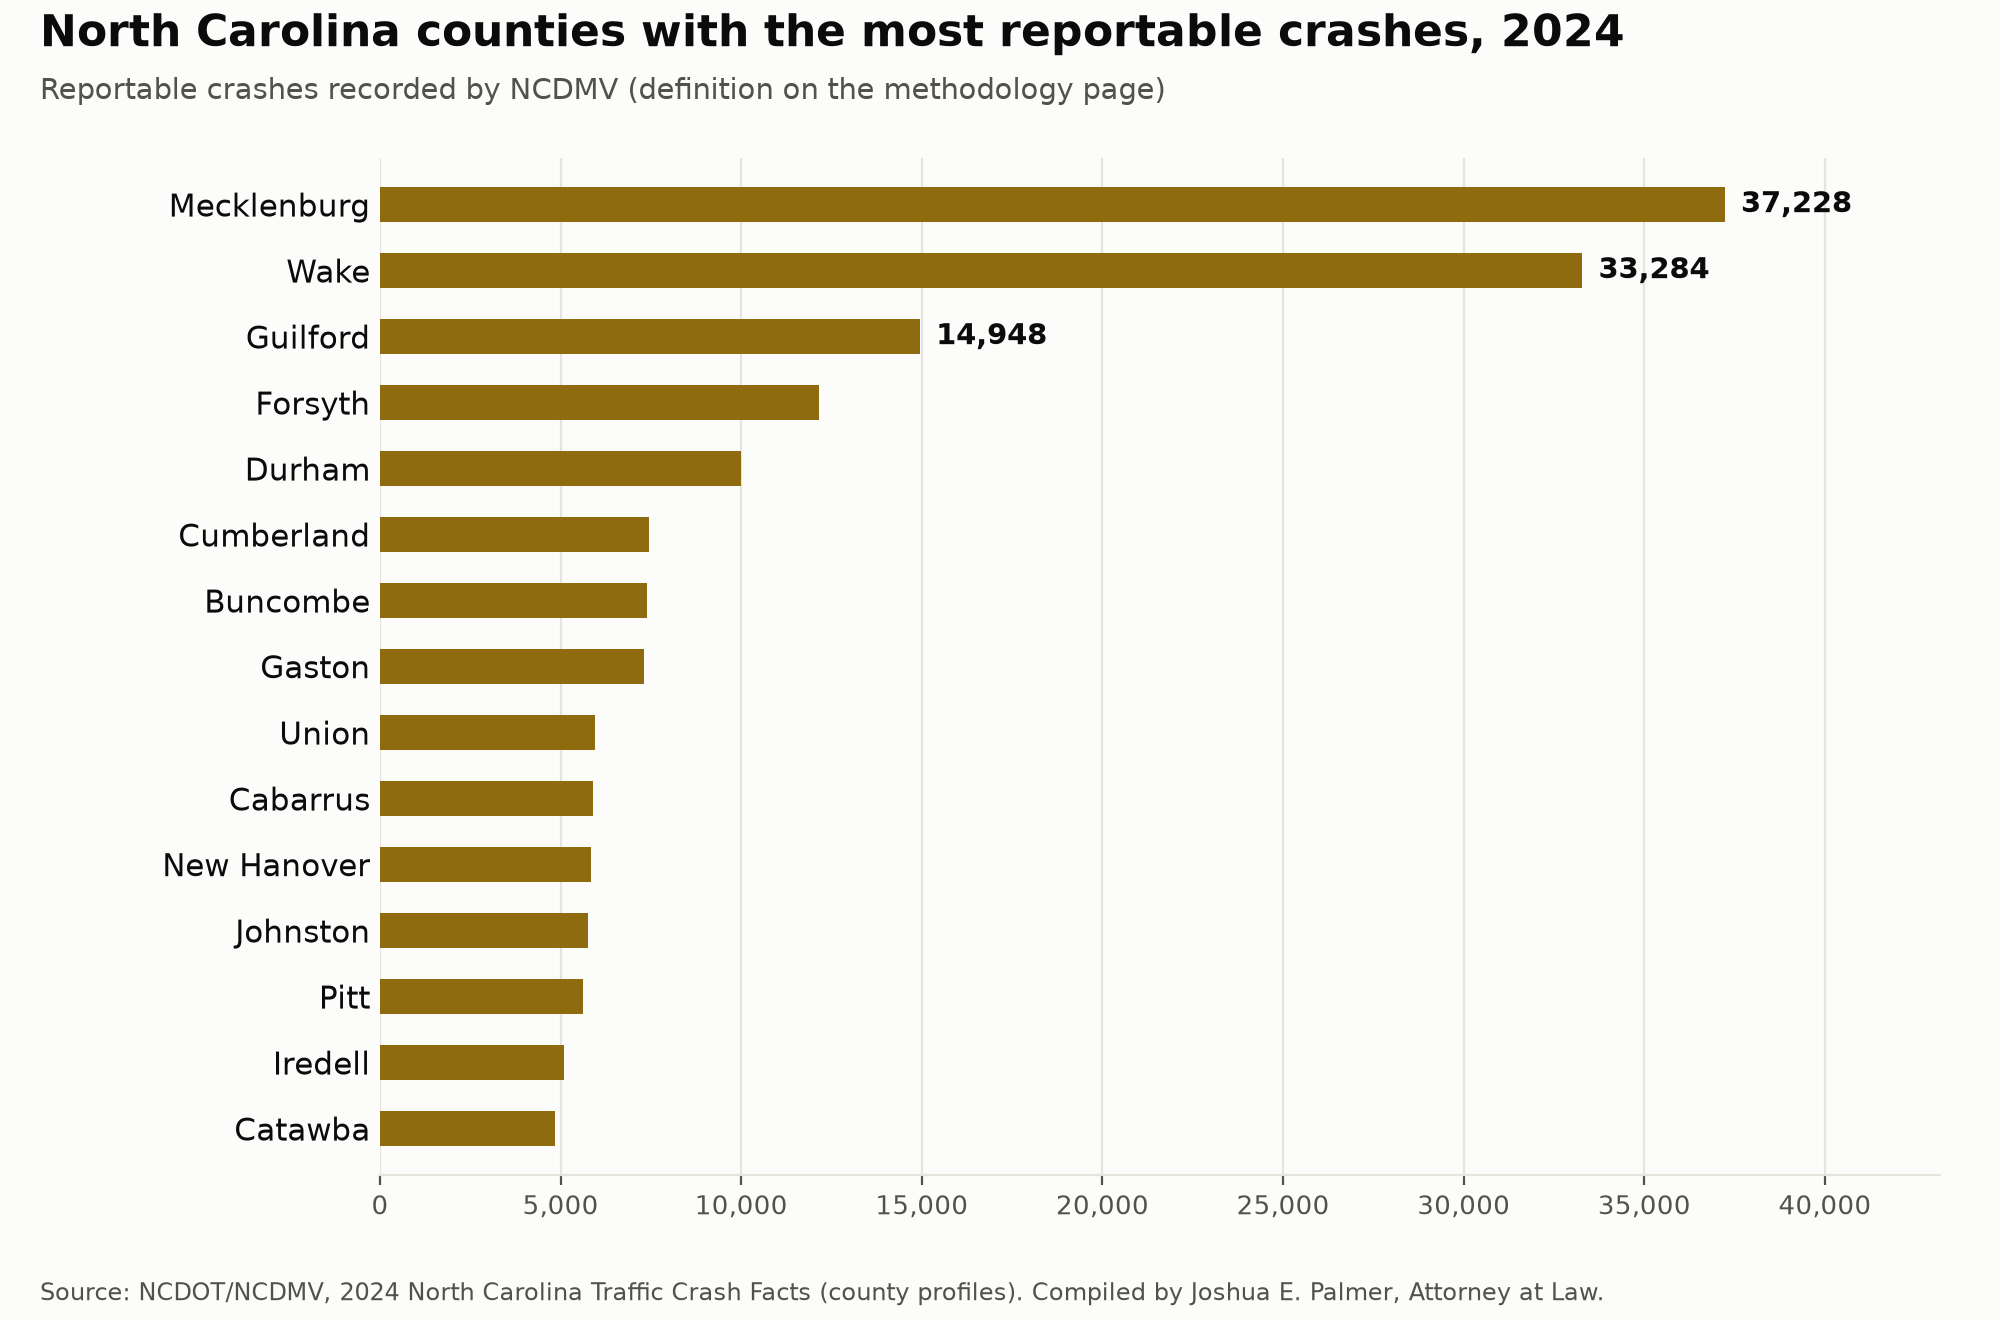
A raw count says where crashes happen, not how likely one is. A county with a million residents and three interstates will always lead this list. The rate measures further down the page ask the fairer question: how many crashes per mile driven, and per registered vehicle.
| County | Crashes 2024 | Change from 2023 | People injured | Share of state |
|---|---|---|---|---|
| Mecklenburg | 37,228 | -1.8% | 16,831 | 13.1% |
| Wake | 33,284 | +1.2% | 12,050 | 11.7% |
| Guilford | 14,948 | +2.6% | 7,950 | 5.3% |
| Forsyth | 12,166 | +1.3% | 4,682 | 4.3% |
| Durham | 10,004 | -0.1% | 3,512 | 3.5% |
| Cumberland | 7,439 | -3.8% | 3,147 | 2.6% |
| Buncombe | 7,379 | -6.6% | 2,292 | 2.6% |
| Gaston | 7,311 | +7.8% | 2,843 | 2.6% |
| Union | 5,954 | +0.8% | 1,982 | 2.1% |
| Cabarrus | 5,892 | -1.1% | 2,240 | 2.1% |
Source: NCDOT/NCDMV 2024 Traffic Crash Facts county profiles; change and share computed from the reported counts.
Injuries track the crash count closely, but not perfectly. 16,831 people were injured in Mecklenburg County crashes in 2024 and 12,050 in Wake County. The chart below ranks counties by the number of people injured; the table that follows shows injuries per 1,000 residents, where several mid-sized and rural counties rank above the big metros.
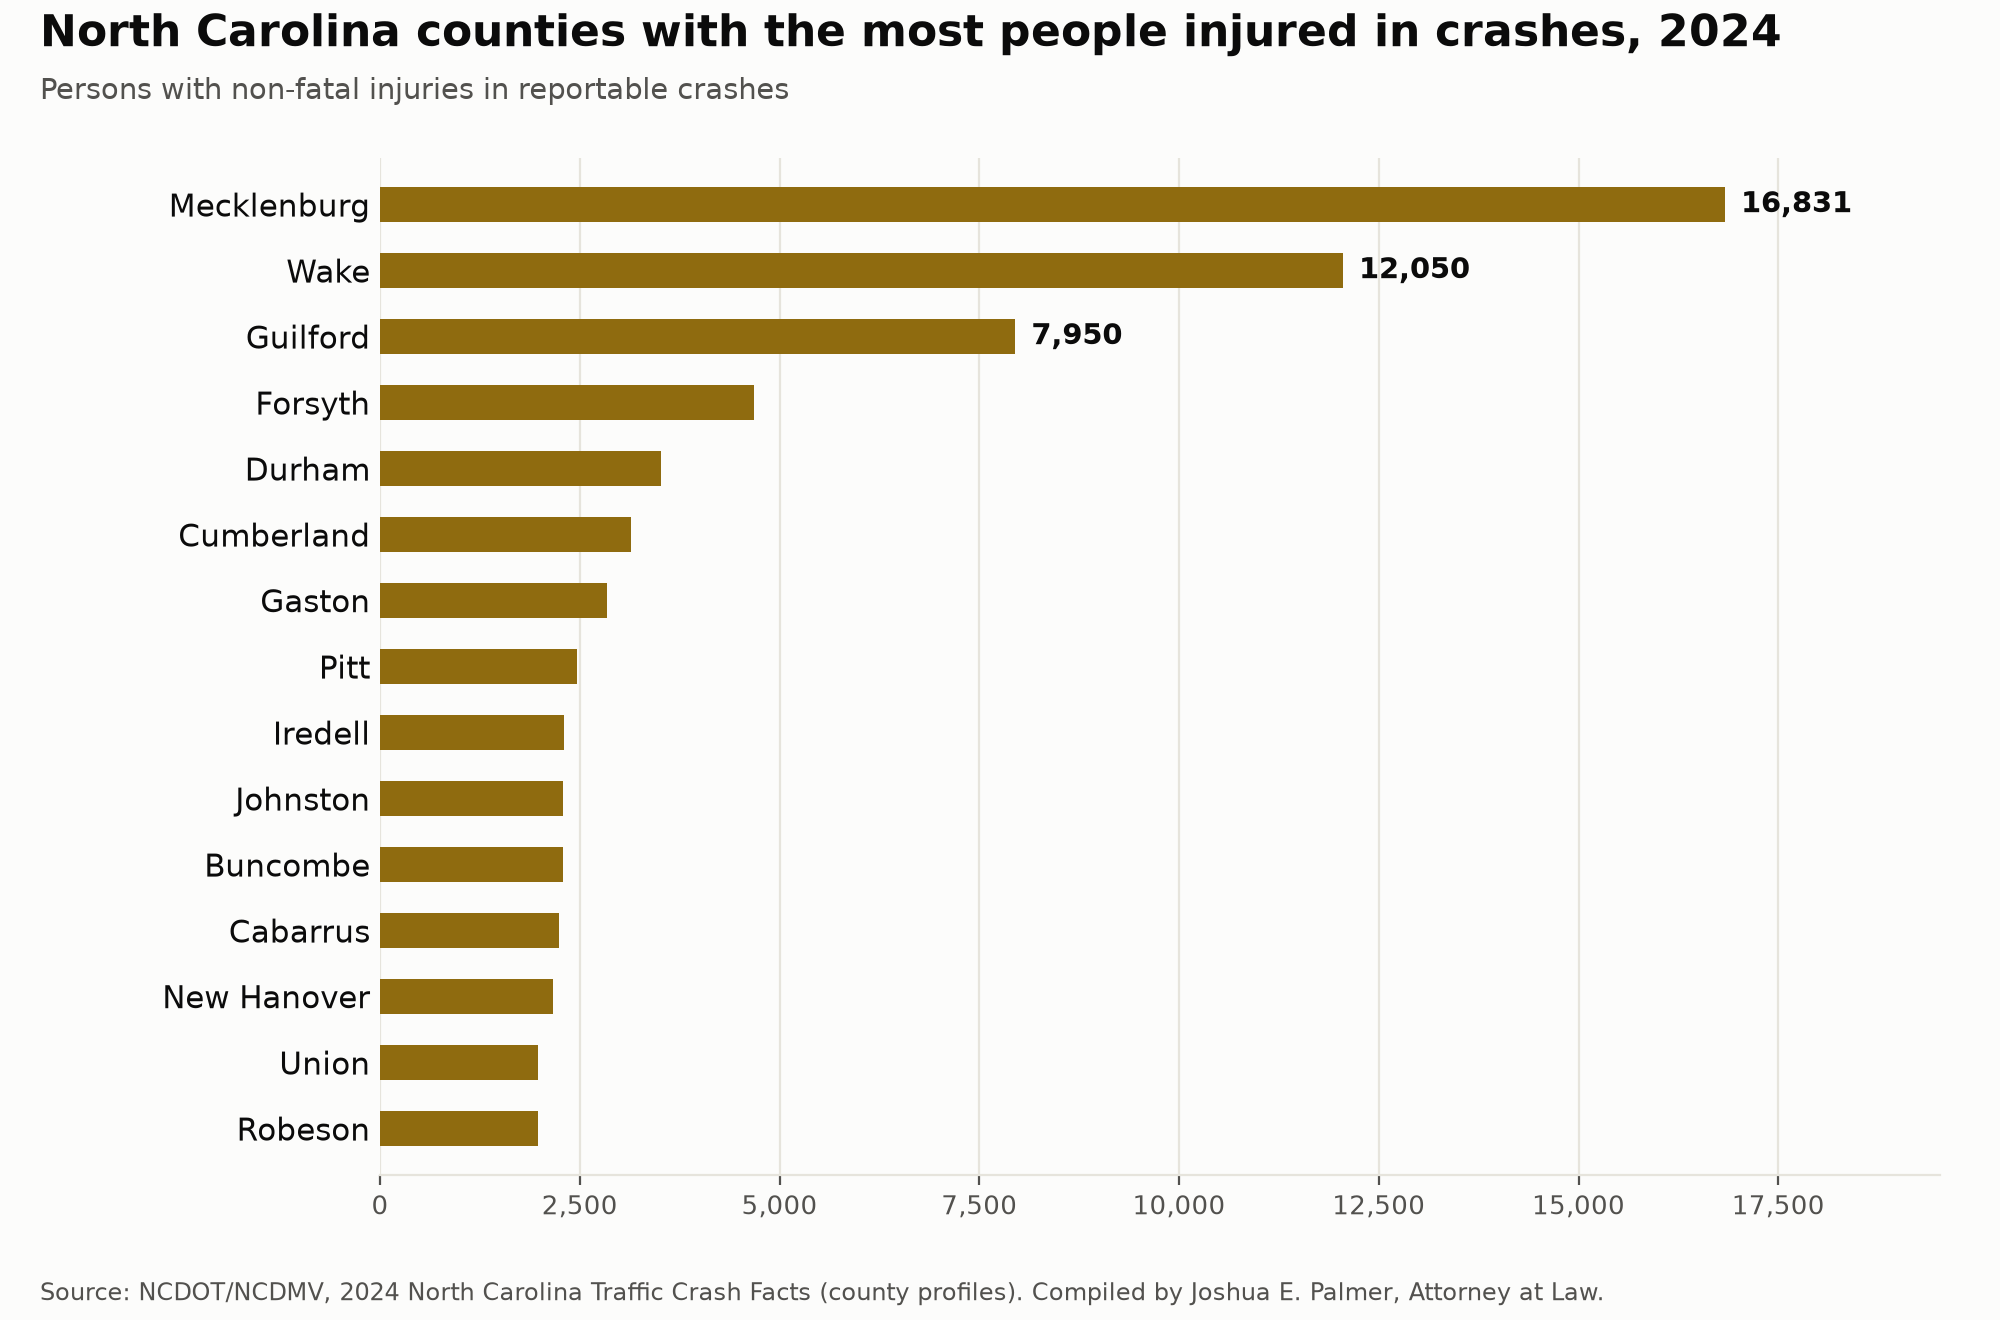
Statewide, 113,602 people were injured in 73,293 injury crashes in 2024, 1.2% fewer people than in 2023 even though the crash count was flat. The injury rate per 100 million vehicle miles fell to 89.42 from 94.15 the year before.
| County | Injuries per 1,000 people | People injured 2024 | Population |
|---|---|---|---|
| Robeson | 17.3 | 1,980 | 116,438 |
| Mecklenburg | 15.5 | 16,831 | 1,162,168 |
| Pitt | 15.2 | 2,468 | 174,842 |
| Guilford | 15.1 | 7,950 | 550,202 |
| Wayne | 14.8 | 1,663 | 117,748 |
| Columbus | 14.4 | 702 | 50,389 |
| Lenoir | 14.1 | 757 | 53,966 |
| Anson | 13.9 | 290 | 21,619 |
| Wilson | 13.6 | 1,011 | 78,792 |
| Duplin | 13.6 | 658 | 49,178 |
Rates are NCDOT’s three-year averages as printed in each county profile.
NCDOT publishes two rate measures in every county profile, each a three-year average: reportable crashes per 100 million vehicle miles traveled, and crashes per 1,000 registered vehicles. The first adjusts for how much driving happens on a county’s roads, the second for how many vehicles are based there. Both lists look different from the raw count. The highest rates per mile are in counties where a lot of through-traffic meets local roads, and the per-vehicle list is led by counties with small vehicle registrations and busy highways.
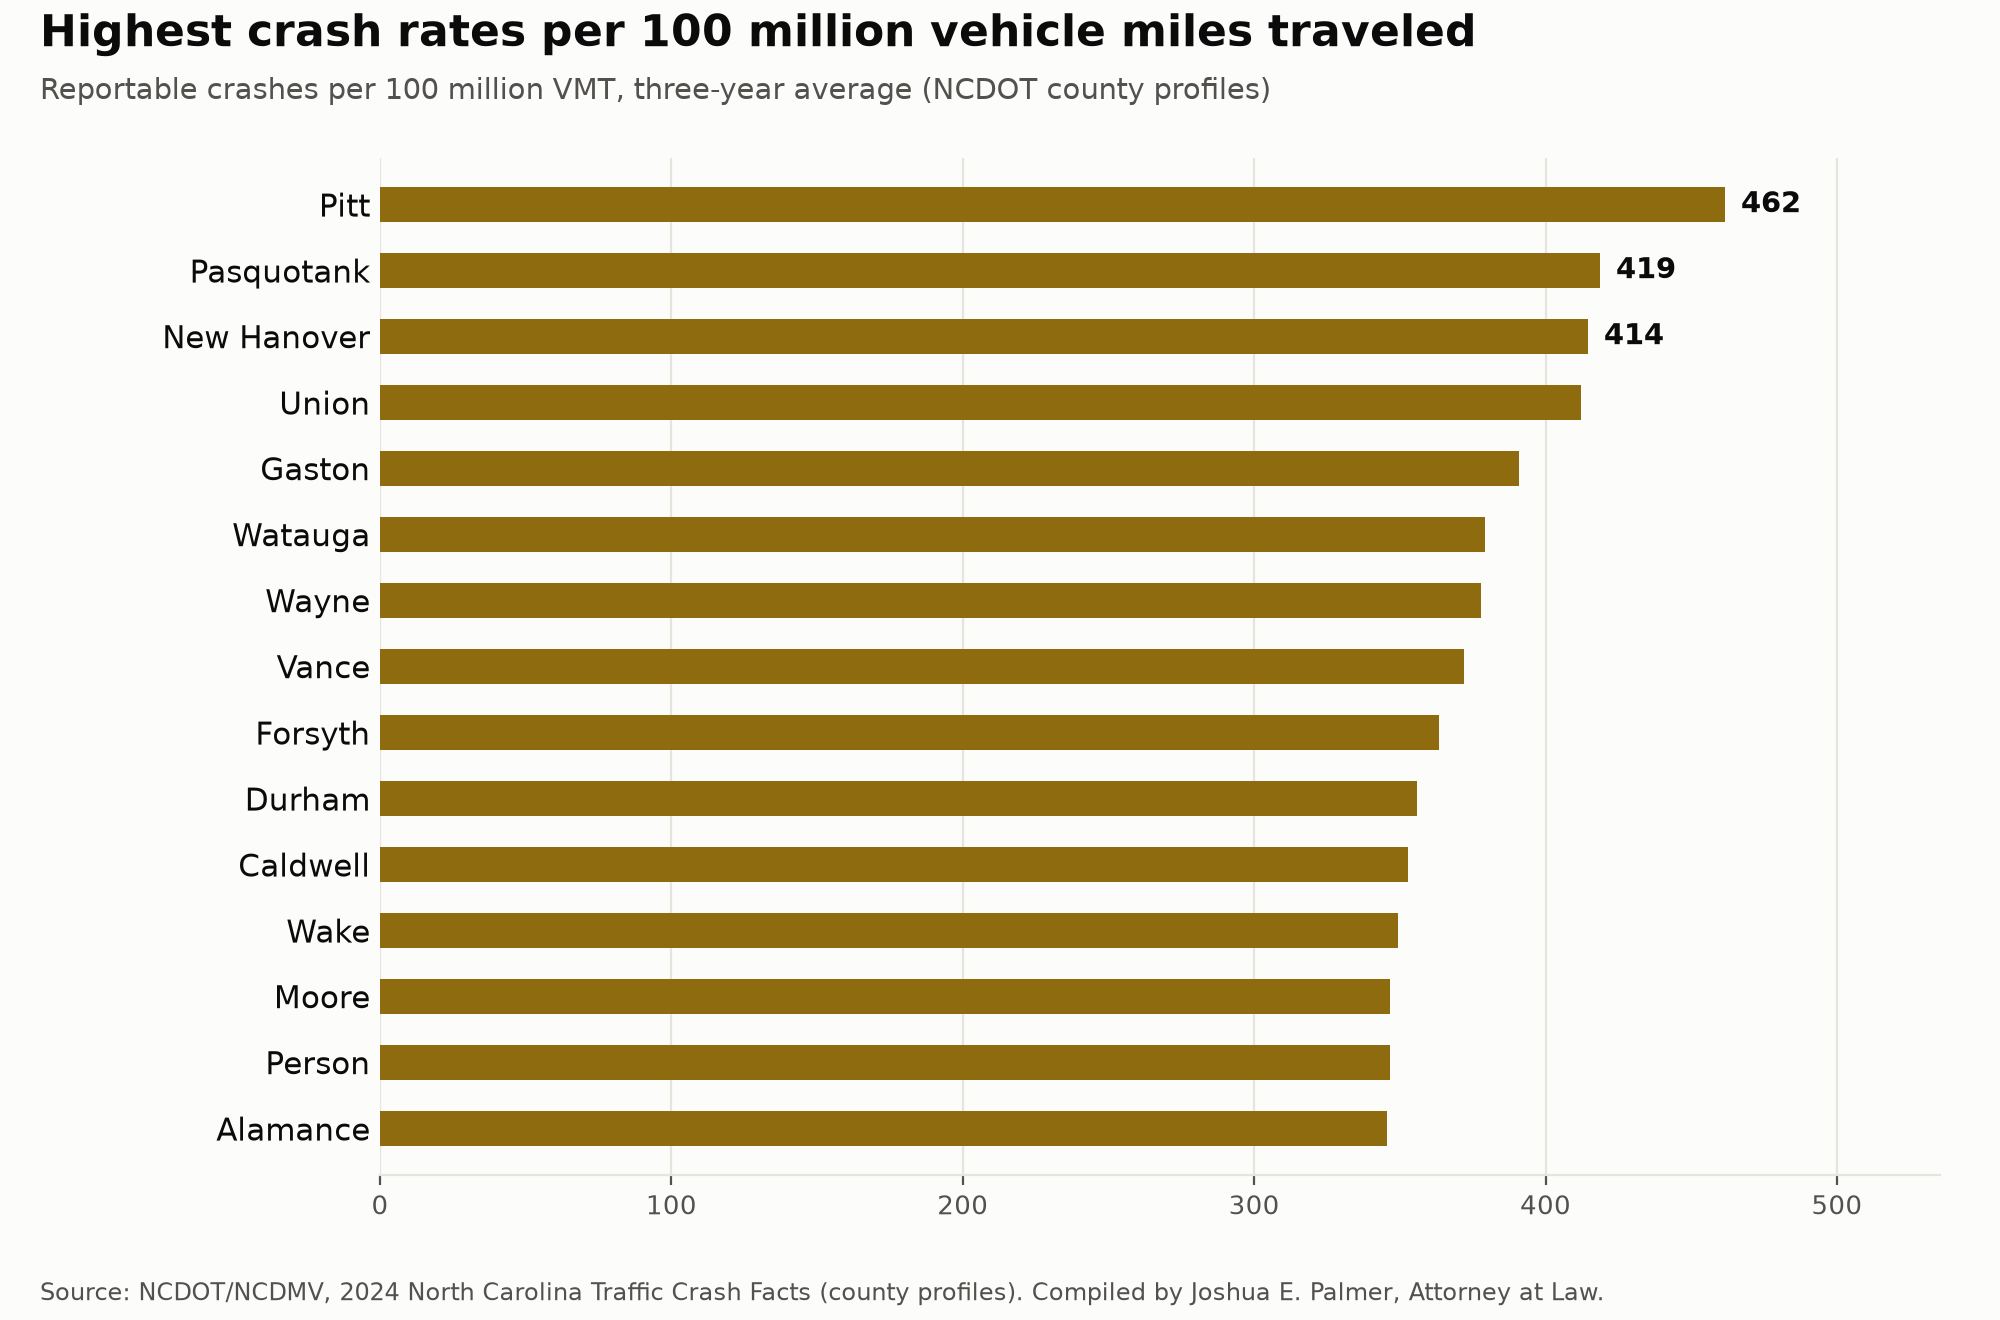
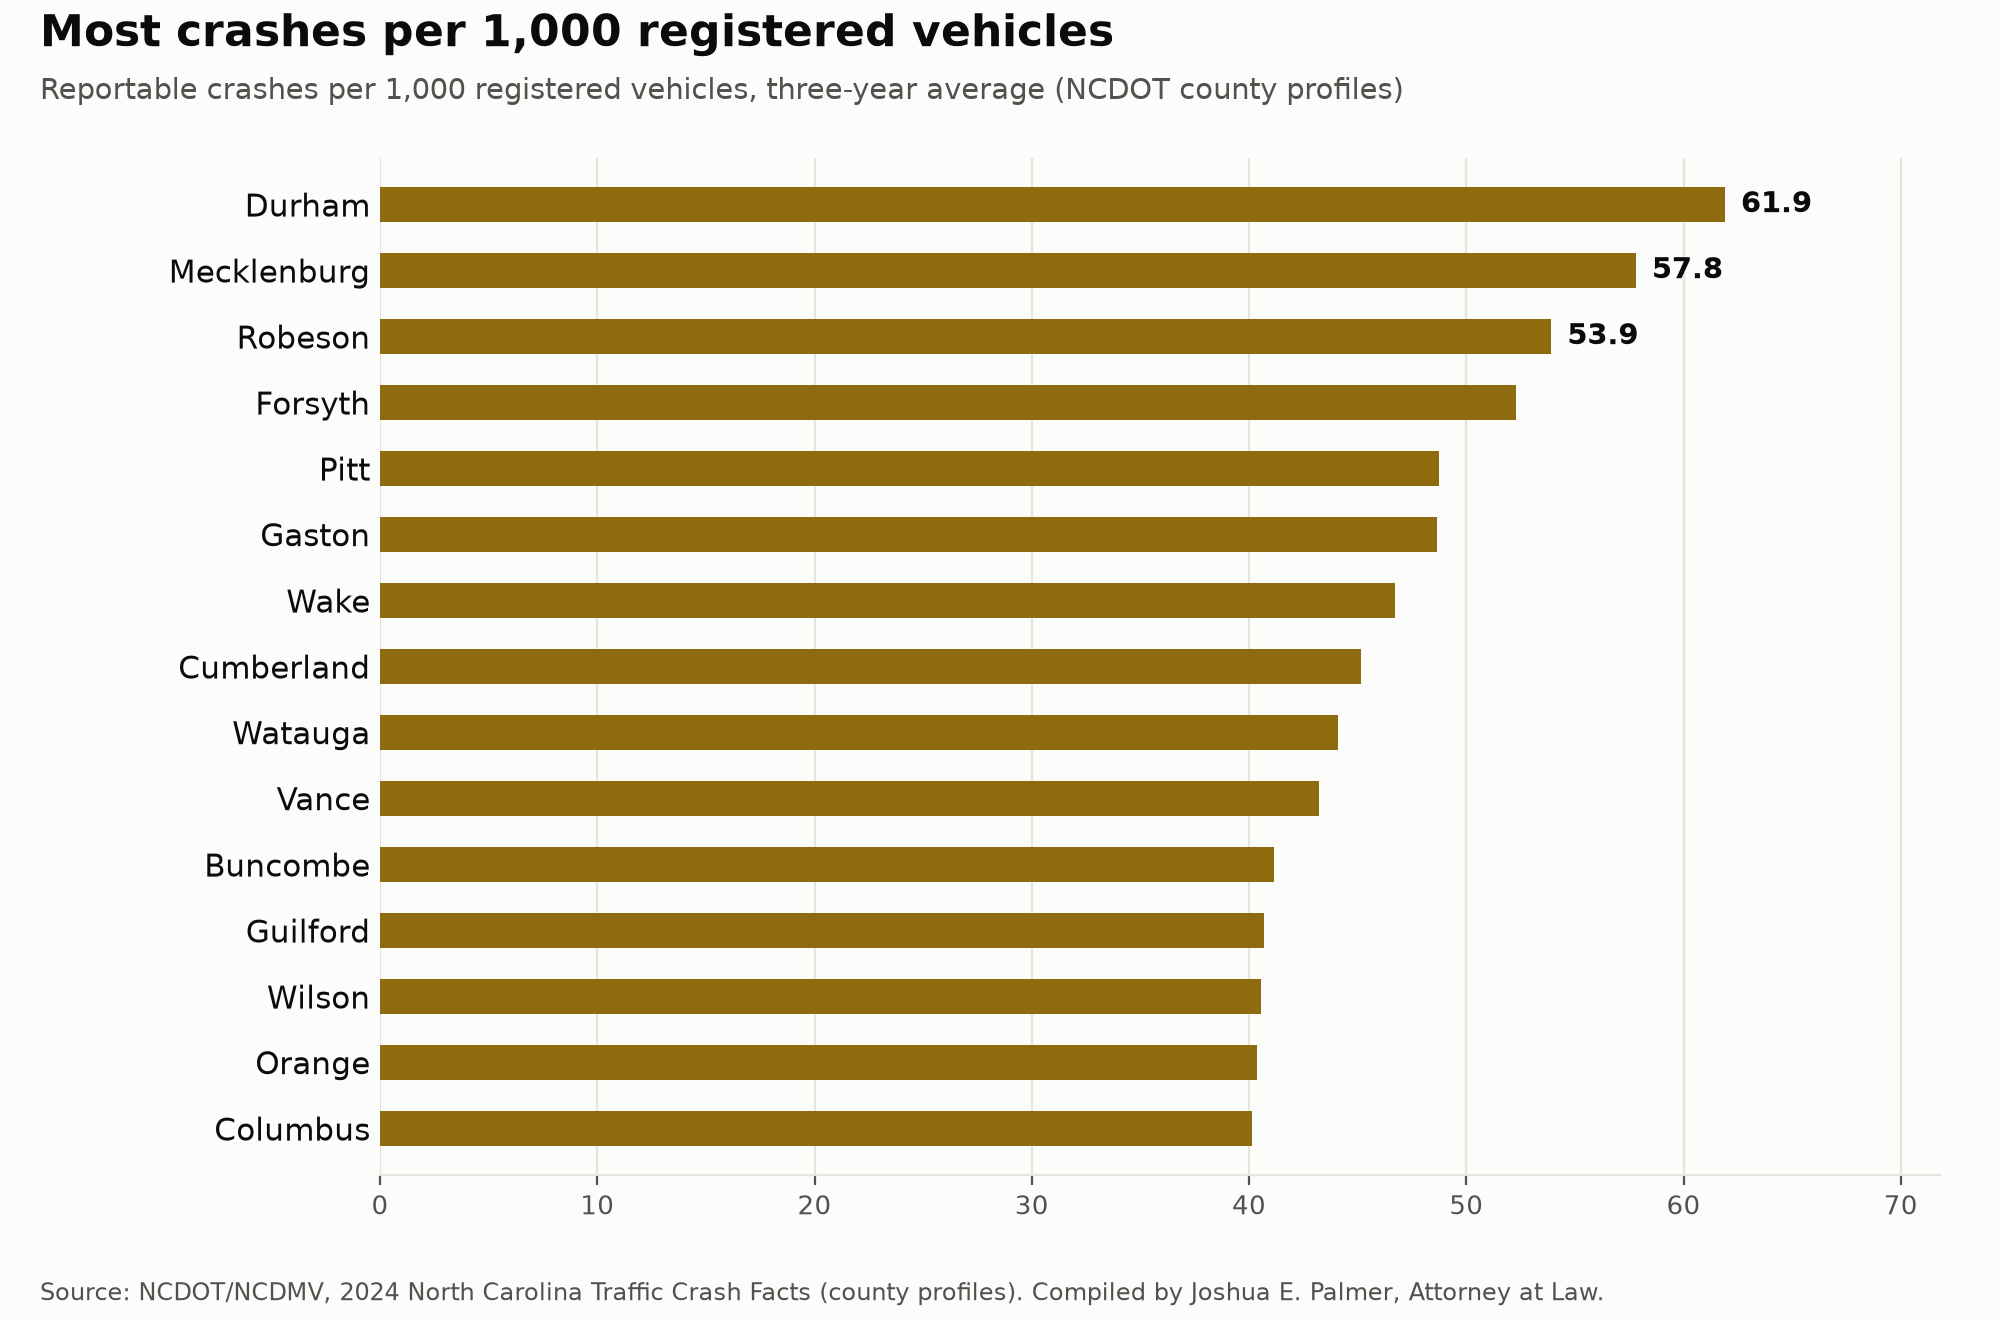
Read small-county rates with care. A county with a few hundred crashes a year moves several places in the ranking on a change of a few dozen crashes, which is why NCDOT reports three-year averages and why this report shows the raw counts beside every rate. The statewide crash rate was 223.99 per 100 million vehicle miles in 2024, down 3.7% from 2023 as miles driven rose 4.0% and crashes stayed flat.
| County | Crashes per 100M VMT | Crashes per 1,000 vehicles | Crashes 2024 |
|---|---|---|---|
| Pitt | 461.5 | 48.8 | 5,611 |
| Pasquotank | 418.6 | 34.7 | 1,001 |
| New Hanover | 414.5 | 39.6 | 5,835 |
| Union | 412.0 | 31.4 | 5,954 |
| Gaston | 391.0 | 48.7 | 7,311 |
| Watauga | 379.3 | 44.1 | 1,423 |
| Wayne | 377.9 | 37.9 | 3,298 |
| Vance | 371.9 | 43.2 | 1,293 |
| Forsyth | 363.4 | 52.3 | 12,166 |
| Durham | 355.9 | 61.9 | 10,004 |
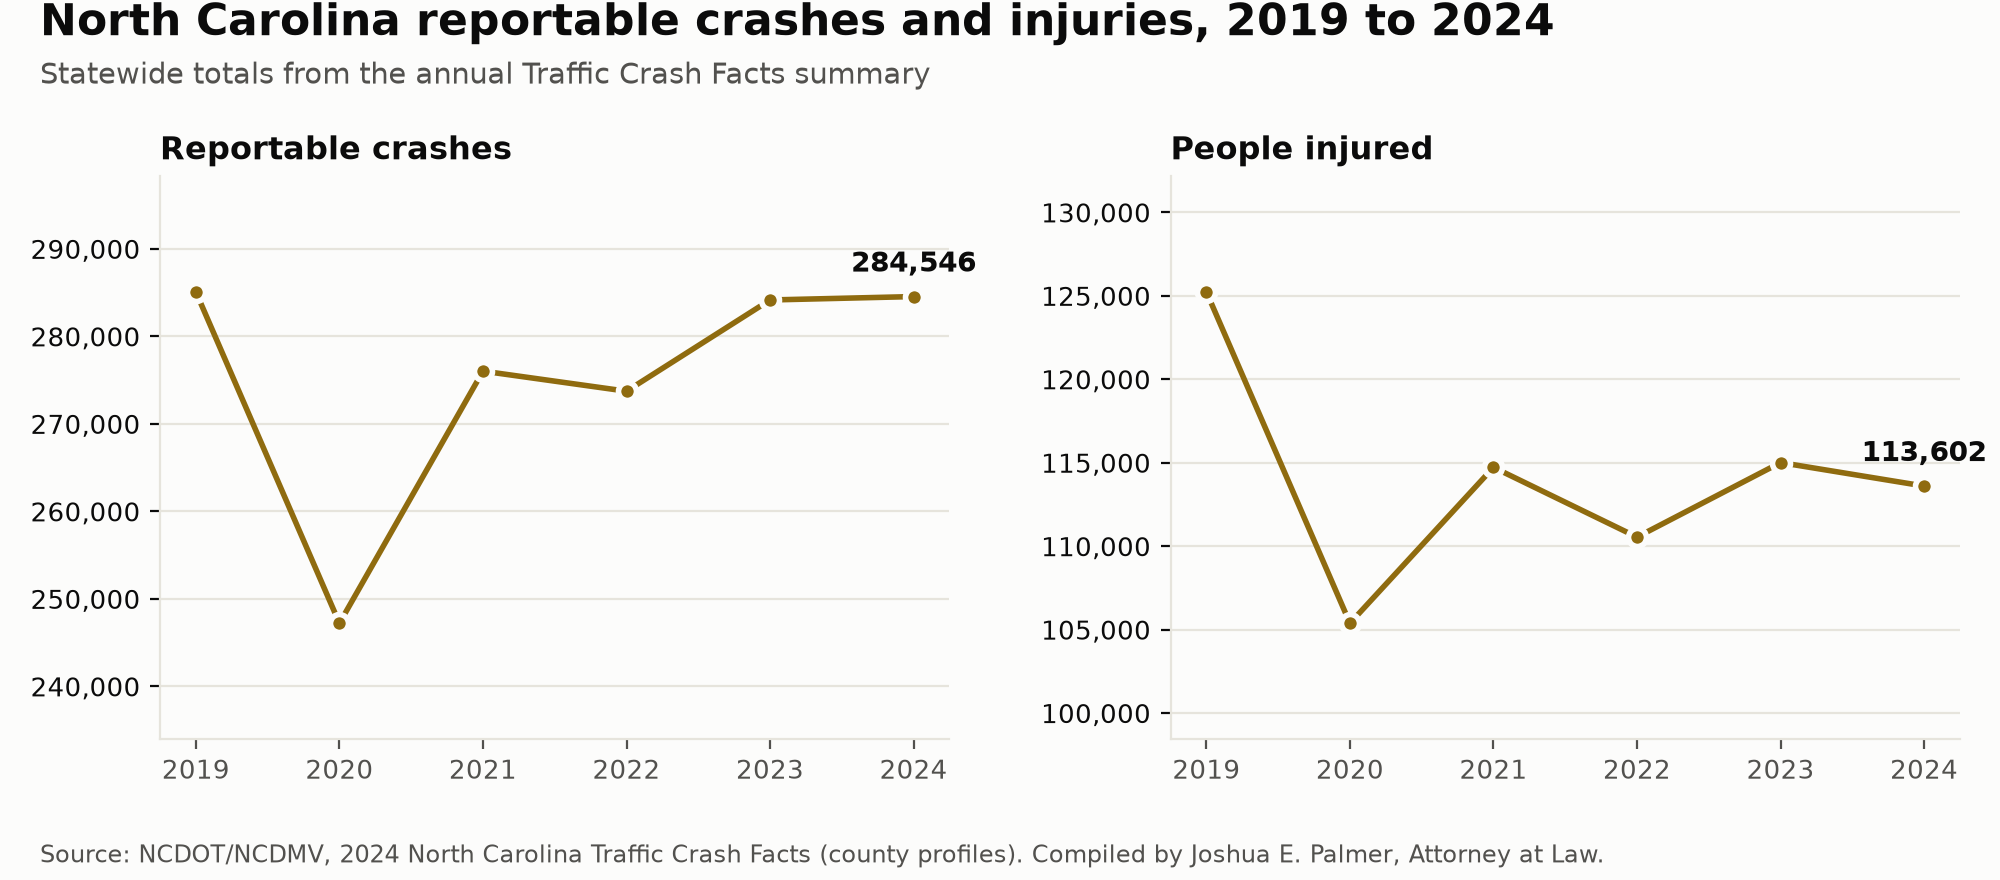
Statewide, reportable crashes rose 0.14% from 2023 to 2024, from 284,157 to 284,546, essentially flat. County by county the picture is noisier. Among the 61 counties with at least 1,000 crashes in 2024, Stanly posted the largest increase (+20.3%) and Haywood the largest decrease (-10.0%). The table lists the five largest moves in each direction; the full table above has every county’s change.
A one-year change is not a trend. The five-year average column in the table smooths the 2020 pandemic dip, when statewide crashes fell to 247,214, and the recovery that followed; most large counties are now above their five-year average.
| County | Crashes 2023 | Crashes 2024 | Change |
|---|---|---|---|
| Stanly | 1,131 | 1,361 | +20.3% |
| Richmond | 1,154 | 1,274 | +10.4% |
| Burke | 2,078 | 2,256 | +8.6% |
| Gaston | 6,779 | 7,311 | +7.8% |
| Wilkes | 1,413 | 1,522 | +7.7% |
| Haywood | 1,638 | 1,474 | -10.0% |
| Halifax | 1,526 | 1,377 | -9.8% |
| Vance | 1,404 | 1,293 | -7.9% |
| Rockingham | 2,077 | 1,928 | -7.2% |
| Wilson | 2,419 | 2,254 | -6.8% |
Computed from the 2023 and 2024 counts in NCDOT’s county profiles.
North Carolina recorded 284,546 reportable crashes and 113,602 injured people in 2024 across 1,270 hundred million vehicle miles traveled. Crashes have returned to their pre-2020 level while miles driven have grown, so the rate per mile is the lowest in the six years the summary covers. NCDOT’s contributing-circumstance data attributes 11,376 crashes to alcohol (4.0% of the total), 15,194 to speed, 59,310 to lane departure and 48,015 to distracted driving; the booklet notes that distraction is self-reported and likely undercounted.
| Year | Reportable crashes | Injury crashes | People injured | Crash rate per 100M VMT |
|---|---|---|---|---|
| 2019 | 285,074 | 80,277 | 125,232 | 232.70 |
| 2020 | 247,214 | 69,001 | 105,382 | 233.39 |
| 2021 | 276,026 | 74,639 | 114,722 | 234.39 |
| 2022 | 273,732 | 71,963 | 110,544 | 230.33 |
| 2023 | 284,157 | 74,161 | 115,009 | 232.62 |
| 2024 | 284,546 | 73,293 | 113,602 | 223.99 |
Source: 2024 Traffic Crash Facts, Summary Data (p. 4).
NCDOT assigns a comprehensive cost to crashes, a figure that includes medical care, lost productivity, property damage and quality-of-life losses, and reports a three-year average annual cost for every county in 2023 dollars. The statewide sum of the county figures is about $41.5 billion a year. Mecklenburg’s annual figure is $4.14 billion and Wake’s $3.49 billion; on a per-crash basis the most expensive crashes are in rural counties where a larger share of crashes involve injury and high speed. The cost columns in the table are NCDOT’s figures, not the firm’s.
| County | Cost per crash | Annual crash cost | Crashes 2024 |
|---|---|---|---|
| Gates | $377,312 | $69 million | 174 |
| Swain | $315,621 | $70 million | 206 |
| Graham | $309,866 | $64 million | 181 |
| Montgomery | $286,296 | $180 million | 535 |
| Warren | $272,820 | $120 million | 389 |
| Scotland | $263,529 | $240 million | 767 |
| Tyrrell | $247,579 | $25 million | 76 |
| Northampton | $231,757 | $121 million | 461 |
| Yancey | $227,123 | $64 million | 262 |
| Madison | $216,007 | $88 million | 412 |
Because the crash report that becomes the evidence in a claim is the same DMV-349 form that feeds these statistics. Every reportable crash in North Carolina, one with an injury or at least $1,000 in damage under N.C. Gen. Stat. § 20-4.01, must be reported to law enforcement under N.C. Gen. Stat. § 20-166.1, and the investigating officer’s report goes to the Division of Motor Vehicles, which compiles the county profiles this report is built from. Our guide to getting your North Carolina crash report explains how to obtain that report and what is on it.
The statistics also show why the state’s fault rule matters so much. North Carolina applies pure contributory negligence: a person found even 1% at fault for a crash can be barred from recovering anything. In a state with more than a quarter-million reportable crashes a year, that rule is the single biggest reason injured people are denied compensation, and our contributory negligence guide explains how it works and when it does not apply. If you were hurt in one of the crashes counted here, the consultation is free and there is no fee unless we win.
The county figures were extracted from the 100 county profile pages of the 2024 Traffic Crash Facts booklet and checked against the statewide totals: the county crash counts sum to exactly 284,546 and the county injury counts to exactly 113,602, the figures NCDOT reports for the state. Rates, population and cost figures are NCDOT’s as printed; the change, five-year average and share columns are arithmetic on the printed counts. The full method, definitions and limitations are on the methodology page.
The compiled dataset is published under a Creative Commons Attribution 4.0 license: newsrooms, safety organizations, researchers and local governments may reuse the table, charts and CSV with a credit to Joshua E. Palmer, Attorney at Law and a link to this page, and to NCDOT/NCDMV as the original source. The report will be refreshed when NCDOT publishes the 2025 Traffic Crash Facts.

Joshua E. Palmer
Managing Partner · Joshua E. Palmer, Attorney at Law
Attorney Palmer concentrates in personal injury law and trained in North Carolina law at North Carolina Central University School of Law in Durham. Contributory negligence is the defense he prepares every North Carolina case to defeat, from the first call with an adjuster to the courtroom.
Hurt in a North Carolina crash? Call for a free case review. We will get your crash report, explain what it says, and tell you where the claim stands under North Carolina law.
Responsible attorney: Joshua E. Palmer, Managing Partner · 106 Moran Dr #5106, Bonaire, GA 31005 · (478) 887-3734. Attorney advertising. This page is general legal information about North Carolina law, not legal advice for your situation; contacting the firm does not create an attorney-client relationship.
Statistics describe the state. A free case review describes your claim: the report, the fault question, and the coverage. No fee unless we win.
Each case is different. Any results, settlement figures, or benefit amounts described on this page depend on the specific facts of that case and do not guarantee or predict a similar outcome in yours. Statutes and benefit rates cited are current as of November 2026; confirm current law with an attorney before relying on it.
📞 Get A Free Consultation · (478) 887-3734